FxWirePro: GBP/USD hovers near four-year high ahead of key U.S. inflation data
  FxWirePro- Woodies Pivot (Major)
  FxWirePro: USD/CNY edges higher but outlook still bearish
  FxWirePro: EUR/AUD uptrend gains momentum, as positive sentiment
  FxWirePro: NZD/USD hovers near 1 -week high,outlook bullish
  FxWirePro: AUD/USD up slightly, but bulls yet to take charge
  BNB Breaks Out: Eyeing $800 and Beyond as Bulls Take Control
  Canadian GDP Drags CAD/JPY Lower: Recession Fears Mount
  FxWirePro: EUR/NZD loses momentum but outlook is bullish
  BNB/USD Consolidates: Gearing Up for the Next Big Move?


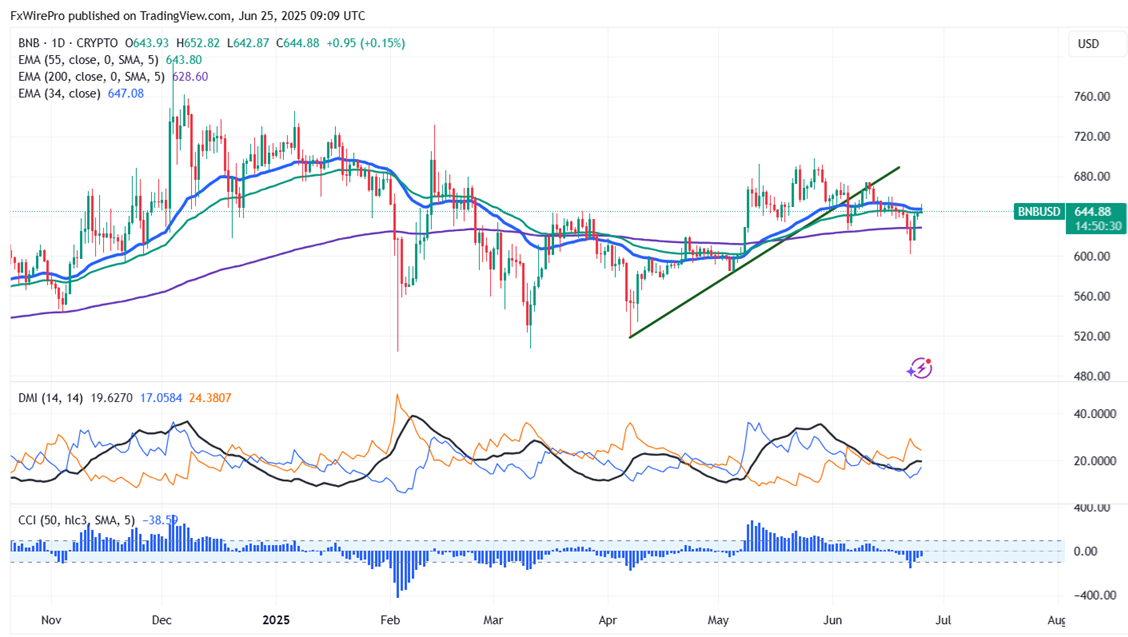
BNB/USD recovered sharply more than $40 following the footsteps of BTC. It hits an intraday high of $652 and is currently trading around $645.17.
Short term trend remains bullish as long as support $598 holds. It trades below the 55 and 34, above 200 and 365 EMA on the daily chart. Near-term support is around $628 (200- EMA) , any close below targets $598/$570/$520. If the pair closes below $500, potentially leading to further declines towards $400.
Immediate Resistance is at $660.Any breakout above this resistance confirms bullish momentum and a jump to could suggest bullish momentum, with further gains possible towards $669/$680/$730/$800/$1000. Near-term resistance is around $680.
Indicators (daily Chart)
- Directional Movement Index: Bearish
- CCI (50): Bearish
Trading Strategy
It is good to buy on dips around $625 with a stop-loss set at $595 and a target price of $800/$1000.